
Case1
Demonstration experiment in transport company warehouse
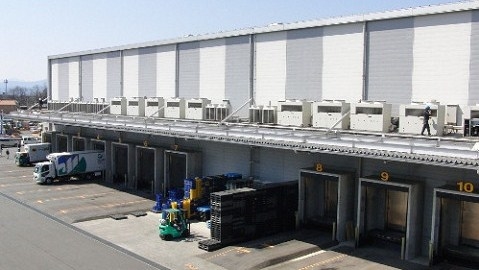
Kanto Unyu Co., Ltd. – KenOu Logistics Center
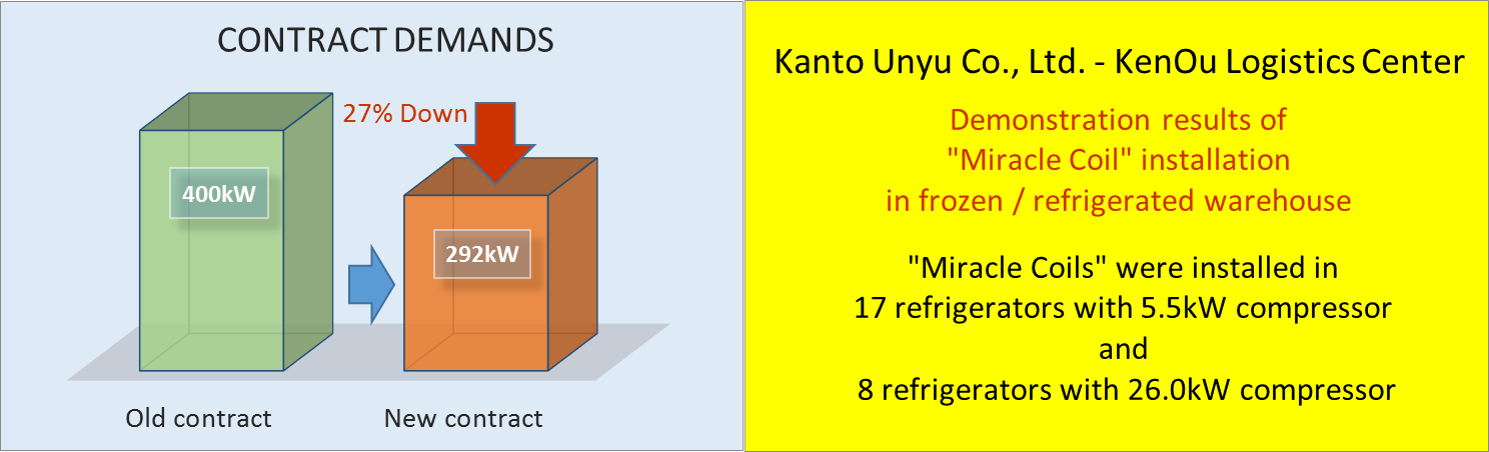
(“Miracle Coils” were installed in 70% of all refrigerators)
In the following [Demand & Power Consumption Graph] values, not only values of refrigerators、but also other power consumption (lighting, machinery, office air conditioning, forklift etc.) are included.
“Miracle Coils” installed Date: March 22 to 26, 2012
“Each Measured value” is totalized for the period from the previous month 8th to the current month 7th. [For example, May value is the totalized value for the period from April 8th to May 7th. 】
Reduction of Demand
 The graph of 2011 is before the installation of “Miracle Coil”.
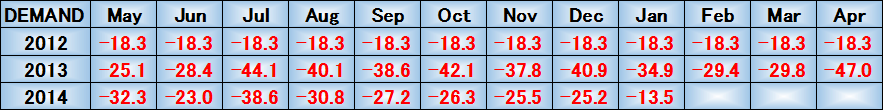
Demand reduction rate (%)
Reduction of Power Consumption
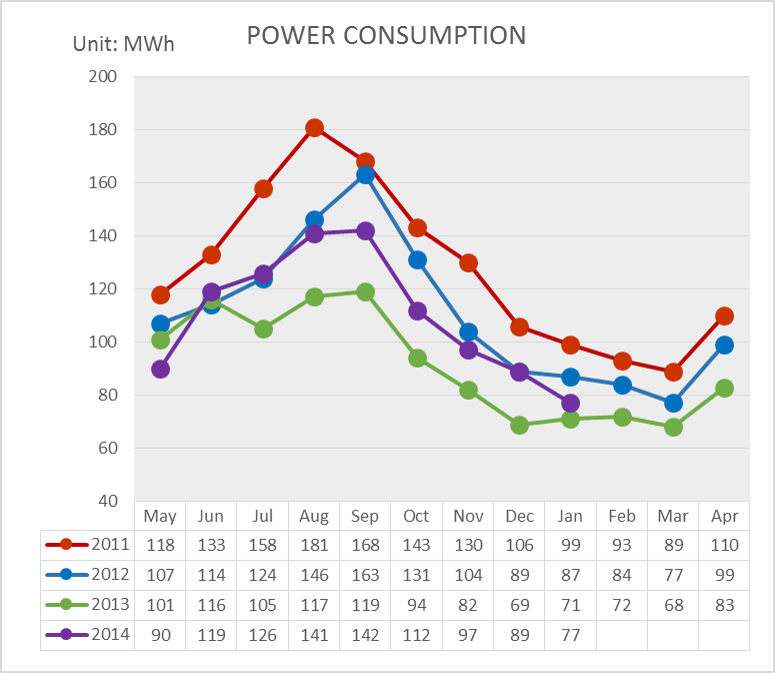
The graph of 2011 is before the installation of “Miracle Coil”.
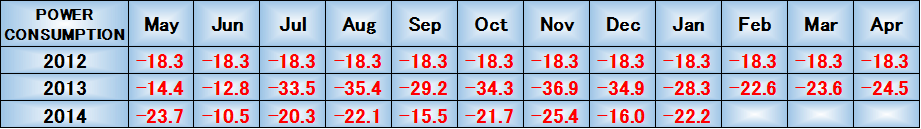
POWER CONSUMPTION reduction rate (%)
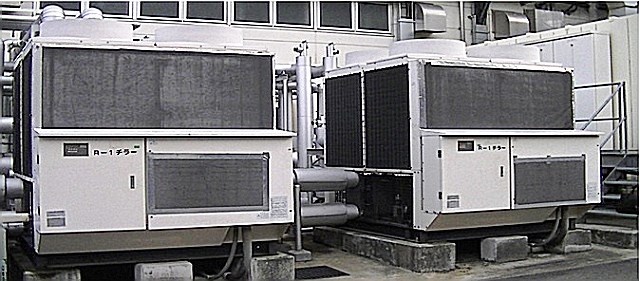
Case2
Energy saving effects of “Miracle Coil” introduced to the chiller
Measured power consumption
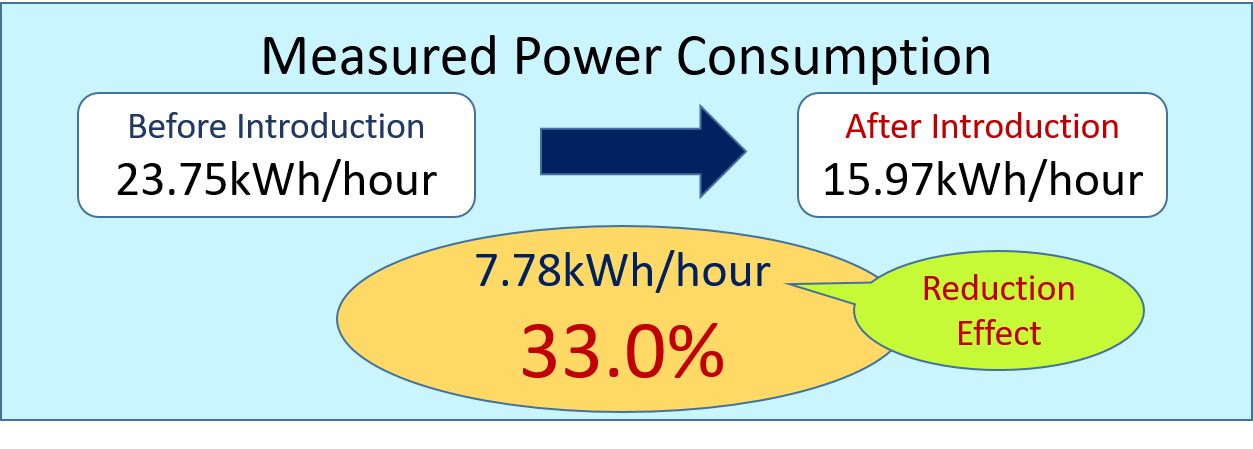
measured Power Consumption
Estimates of Power Charge
calculation condition : 2 Units of Chiller (22kW/Unit)
Unit price of electricity : @21.55 Yen/kWh
Annual operating hours : 24hr x 365days x operating rates 70%
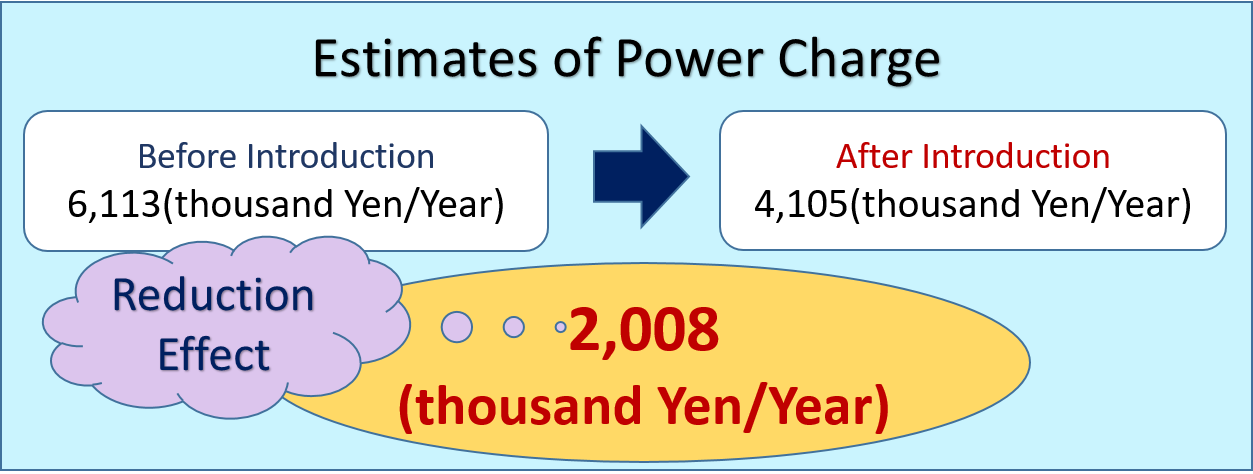
Estimates of Power Charge
Calculation of payback period on Capital investment
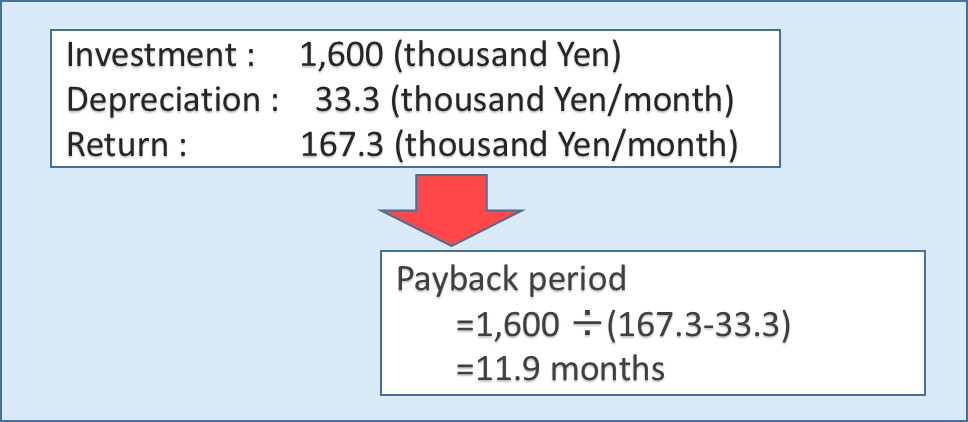
Calculation of payback period